

A number of key climate related satellites went into service in 1979, which coincidentally was the coldest year since the 1920s in the US (according to USHCN raw data) and also the year of peak Arctic ice. This has caused satellite temperature and Arctic ice trends to be unrepresentative of the long term patterns, and allowed them to be used as propaganda. It also occurred shortly before the eruptions of El Chichon and Mt. Pinatubo, which further dragged temperatures down.
Further aggravating the problem is that NSIDC chooses to not report satellite data prior to 1979, which inconveniently shows that there was a lot less Arctic ice in 1974 than there was in 1979.
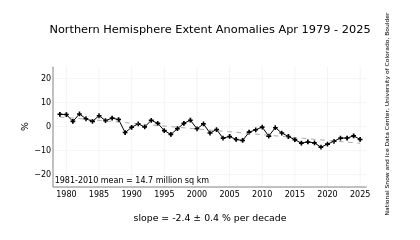
NSIDC shows this :

but they don’t show what happened during the five years prior to 1979.

www.ipcc.ch/ipccreports/far/wg_I/ipcc_far_wg_I_full_report.pdf
Satellites are a useful tool, but it would be nice to have an honest discussion about the severe limitations of the data set.

This may be related. It’s from Christy’s testimony today.
“The recent claims about thousands of new record high temperatures were based on stations whose length-of-record could begin as recently as 1981, thus missing the many heat waves of the 20th century. Thus, any moderately hot day now will be publicized as setting records for these young stations because they were not operating in the 1930s. The figure below gives what a climatologist would want to know because it uses only stations with long records.”
Let’s see what the Oct 27 Polar satellite launch brings to the table.
If it’s warmer than the coldest year on record, it must be catastrophic warming (sarc.).
Hi Steven,
Still a little puzzeled when comparing 2 graphs with different scales?
The IPCC graph shows for 1975 to 1979 expanson of less than 5%
Considering what you see here,
http://arctic.atmos.uiuc.edu/cryosphere/IMAGES/seasonal.extent.1900-2010.png
your point contradicts your statement:
“but it would be nice to have an honest discussion”
Can you tell the difference between a positive and a negative slope?
Yes, I can,
So what is you interpretation of
http://arctic.atmos.uiuc.edu/cryosphere/IMAGES/seasonal.extent.1900-2010.png
It is not the direction of the slope: put your 1974 to 1990 values into the other graph:
You will see they make not that much of a difference.
The graph you linked is complete garbage. Someone just made numbers up
http://stevengoddard.wordpress.com/2012/05/02/yet-another-arctic-data-problem/
Are we going to believe the collation and analysis of data from the new Polar satellite? NASA’s history of fabrication and lies doesn’t inspire confidence.
these data are neither form NASA (satelites) nor were they calculated by NASA.
They are just plain wrong. Someone took a pencil and made up numbers which don’t even vaguely match the available data
http://stevengoddard.wordpress.com/2012/05/02/yet-another-arctic-data-problem/