

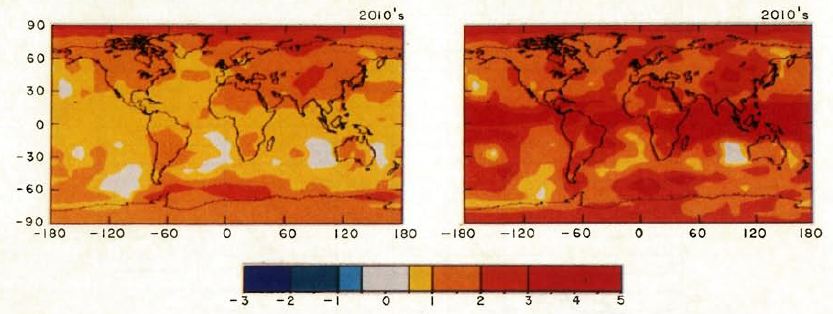
Hansen’s 1988 forecasts for right now.
Both poles are currently experiencing recent record highs in ice extent. Why is this important?
Because it indicates that there are very cold temperatures at both poles, and casts doubt on Hansen’s claims of hottest year ever exacerbated by polar amplification.
We wouldn’t be seeing the recent rapid ice growth if Hansen were correct. We should be seeing historic minimums at both poles.

Historic in what sense? The amount of data they have to make the claim of “historic” is pathetically small. Yet the claim is continued. Before 1979, there was only anecdotal evidence, and then even not consistently. And what about Antartica? How long have the eyes in the sky been watching that place?
The reality is we do not know. And the wise ones are the ones that admit that fact, not create records out of a lack of data.
And yet no one complains when Steve states that “Both poles are currently experiencing recent record highs in ice extent” based on data that go back to 2003 at most.
Is the inclusion of the vague “recent” supposed to excuse this?
So you didn’t read this article before posting?
Steve, your article is wrong, Hansen’s theory does not imply that there will be strictly decreasing ice extent, because there is interannual varaibility in sea ice extent cause by weather which has a magnitude greater than that of the long term trend. The inter-annual variability averages out over time, but the long term trend doesn’t. That is why short term trends are meaningless. You would realise that if you looked at the full satelite record, where you will find it is quite common to find a run of several years in which the minimum extent increases, even though the long term trend shows a clear long term decline.
Real scientists use tests of statistical significance to protect themselves from making that type of error.
This is a question of physics, not statistics. If temperatures were hottest on record as Hansen claimed we would be seeing record lows, not record highs.
Molecules don’t concern themselves with the future or the past.
The interannual variability is caused by the laws of physics as well. Physicists understand the idea of “noise” just as well as statisticians do.
Your argument is a bit like saying that physics suggests that in the Northern hemisphere summer temperatures are strictly increasing until mid-summer and then strictly decreasing until mod winter. However we know that isn’t true, there is chaotic variability (known as “weather”) that obscures the underlying trend, so we shouldn’t be surprised to see three sucessively cooler days in early summer or three successuvely warmer days in early winter. Likewise there is inter-annual variability in sea ice extent caused by variation in Arctic weather. If you recall, it was partly unusual weather patterns in the Arctic that caused the 2007 record minumum ice extent.
Hansen’s maps show 2010 Arctic temperatures far above normal. If he were correct, the ice would be at a record low.
No, becuase there is more to melting of sea ice than near surface air temperatures, which is what GISSTEMP measures. Go read the NSIDC reports, which is where I found out about it.
NSIDC does not change the rules of physics.
No, but the scientists at the NSIDC do spend their working lives applying their knowledge of physics (acquired by years if study and research) to understand what is happening in the Arctic. If you think your knowledge of the physics of ice melt is better than the scientists at the NSIDC, then I would venture to suggest that that is rather unlikely to say the least.
All of the variables boil down to temperature and wind.
You do realize that I have been having guest articles on this blog by NSIDC staff at least once a week?
You have just pretty much made my point for me, if boils down to temperature and wind, then increasing temperatures does not imply uniformly decreasing sea ice as it doesn’t factor in the effects of the wind.
Steve Goddard wrote: “You do realize that I have been having guest articles on this blog by NSIDC staff at least once a week?”
I’d be interested to hear their views on whether the sea ice extent is at a record high. ;o)
Why don’t you quote my entire sentence?
Because the full quote is visible a few lines above?
Seriously I don’t see how my comment was a misrepresentation.
Increasing arctic temperatures will tend to produce a reduction in sea ice extent, nobody disagrees with that. But if e.g. wind conditions are less favourable than usual to melting you may get less melting and hence a higher minimum sea ice extent than the previous year even though it was warmer. Thus increasing polar temperatures does not automatically imply record lows in ice extent.
Just for completeness, air pressure and humidity also affect how quickly ice disappears.
ChrisD writes “Just for completeness, air pressure and humidity also affect how quickly ice disappears.”
It also isn’t true that temperatures in the Artcic have been strictly increasing. No reason it should at temperature doesn’t only depend on CO2 levels, and the Arctic has weather just like everywhere else. Looking at the GISSTEMP data here:
http://data.giss.nasa.gov/gistemp/tabledata/ZonAnn.Ts+dSST.txt
The arctic temperature anomalies (64N – 90N) are as follows:
2005 215
2006 177
2007 208
2008 150
2009 143
It is worth looking at the diagram provided in the article from Steven friend at the NSIDC
http://stevengoddard.wordpress.com/2010/10/08/update-from-julienne/
You can see that the model output does not suggest year on year decreases in ice extent, instead it has just the same sort of interannual variability as the observations, including short periods of expansion within a longer term decreasing trend.
Ice has formed this autumn at a record rate – because temperatures are very cold. Obviously Hansen’s claims of record heat are wrong.
Why don’t you go make some ice cubes in your oven? You seem to think your words can change the rules of science.
Not that simple, 2005 was warmer than 2007, but the ice extent in 2007 was much lower than 2005. Temperature is not the only thing that controls ice extent.
This year is only a record high if you ignore the data prior to the DMI dataset. Explain in what way this year is a record high according to the NSIDC
http://nsidc.org/data/seaice_index/images/daily_images/N_stddev_timeseries.png
I’ve written thousands and thousands of lines on this subject, which obviously you haven’t read.
But the bottom line is that ice forms when it is cold. period.
I would venture to suggest that perhaps you should have read more before you started to write.
Why not ask your contact on at the NSIDC to comment here on this. I read her earlier article and I thought her comments were very insightful. I would be very interested to hear whether she would agree that this year had seen a record high ice extent.
You seem to be getting increasingly desperate. Obviously it is the highest DMI extent for the date. Anyone with even a minimal understanding of graphs can see that.
Yes, I know she will agree that it is a record in that rather narrow sense, I agree with that as well. However she will also point out that the whole statelite record will show the current ice extent is much lower than average for this time of year. In which case it is a rather funny sort of record high.
I would also expect she would explain why natural variability means you will get occasional periods of growth even during a long term decline, and they are not indicative of a long term recovery, nor do they contradict to model predictions.
You seem determined to change the subject.
Ice is forming quickly – because it is cold. Not record heat as Hansen claims.
I’m not changing the subject at all. If you think I am it is an indication that you are so blind to the flaw in your reasoning that you don’t recognise the relevance of the point being made. You wrote:
“If temperatures were hottest on record as Hansen claimed we would be seeing record lows, not record highs.”
This is incorrect becuase ice extent does not depend solely on temperature, so you will see record lows when the other factors controlling ice extent (such as wind) amplify the effect of increased temperature but not when they counteract them.
While we are in a “record high” in the sense of a record high in the DMI dataset, if you look at the whole satelite record you will find that the current extent is more than two standard deviations below the average, so actually there is nothing very unusual about it in the context of a long term decline.
There we are, back full circle, we won’t go round again thanks, life is too short.
Actually, the Arctic is experiencing a record low volume, so far as we can tell. Extent is not falling as fast as volume – which is (and was) readily predicted from the fact that sea ice is essentially a large thin plate. You’re wrong to claim that the Antarctic should also be at a record low: no climate model predicts this.
Who is “we?”
Navy PIPS shows ice thickness much greater than 2008 or 2009.
Real scientists use tests of statistical significance to protect themselves from making that type of error.
Really, seriously? You mean like Michael Mann?
Global area anomaly is less than zero currently.
Andy
Ice recovery is apparently underway, I think La Nina,which is building very fast
will have her say about ice this and next year.
Are we in such a rush that we simply can not summon the patience to wait a few decades to see if all this theorizing is correct or not ? Are we such children that we must have instant gratification ?
Hansen says we have less than two years to save the planet.
Then it is already too late. A nation can act in that time frame. 200 never will.
Hanson has a rather poor record on predictions. Some say that Observational Science is perhaps not true science at all and models are simply engineering.
Ignoramus et ignorabimus
Just a quick comment on Arctic amplification. I sent Steve a couple of images for the month of September that show amplified warming over the Arctic, focused over the areas of ice loss, but also extending with height in the atmosphere and spread out over a larger area. As there is more open water in September, before the Ocean can once again refreeze in winter it must first release the heat it gained during summer. This will be seen in amplified warming of near surface air temperatures, extending with height in the atmosphere. The last several years have shown anomalously warm autumn temperatures related to more open water in September.
NSIDC briefly discussed the apparent paradox of rapid autumn ice growth and amplified warming (nsidc.org/arcticseaicenews/2008/111008.html)
Thanks Julienne.
Your comments are posted here :
http://stevengoddard.wordpress.com/2010/10/12/julienne-on-arctic-amplification/
We wouldn’t be seeing the recent rapid ice growth if Hansen were correct. We should be seeing historic minimums at both poles.,/i>
That’s not true. It’s happening because James Hansen is correct. It’s just you haven’t correctly interpreted Hansen’s predictions. People who say Nostradamus isn’t right have the same problem with interpretation. Mark my words—Hansen is right.
sarc off
BTW…the ice growth rate thus far through October averages to be 106,000 sq-km per day. In the 1980s (1979-1989), average ice growth rates for October were 130,000 sq-km per day. In 2007 it was 124,000 sq-km per day and in 2008 it was 139,000 sq-km per day. In that perspective, nothing too unusual going on with the ice growth rate thus far.
For the DMI record, total growth of 30% ice is the fastest since mid-September. Clearly we are not seeing a repeat of 2007 – when warm water inhibited growth.
SSTs from MODIS indicate that 2010 ocean skin temperatures were not as warm as in 2007. You’re right that in 2007 some regions (i.e. the Chukchi) did not freeze up until December.