
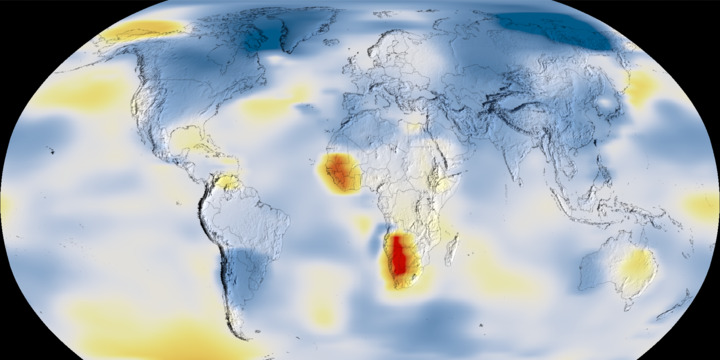
The most active US hurricane season was 1886, when Texas was hit by four hurricanes and Florida was hit by three, yet according to NASA’s very detailed (and fake) global temperature map, Atlantic temperatures were quite cool.


How do they create these very detailed maps with almost no temperature data?

Data.GISS: GISS Surface Temperature Analysis (v4): Station Data
