
Satellite sea level measurements have an error just as large as the trend they claim to measure. They hide this by using a different color scale in their error maps


I created this version of their error map by adjusting the color scales to be the same in both maps.

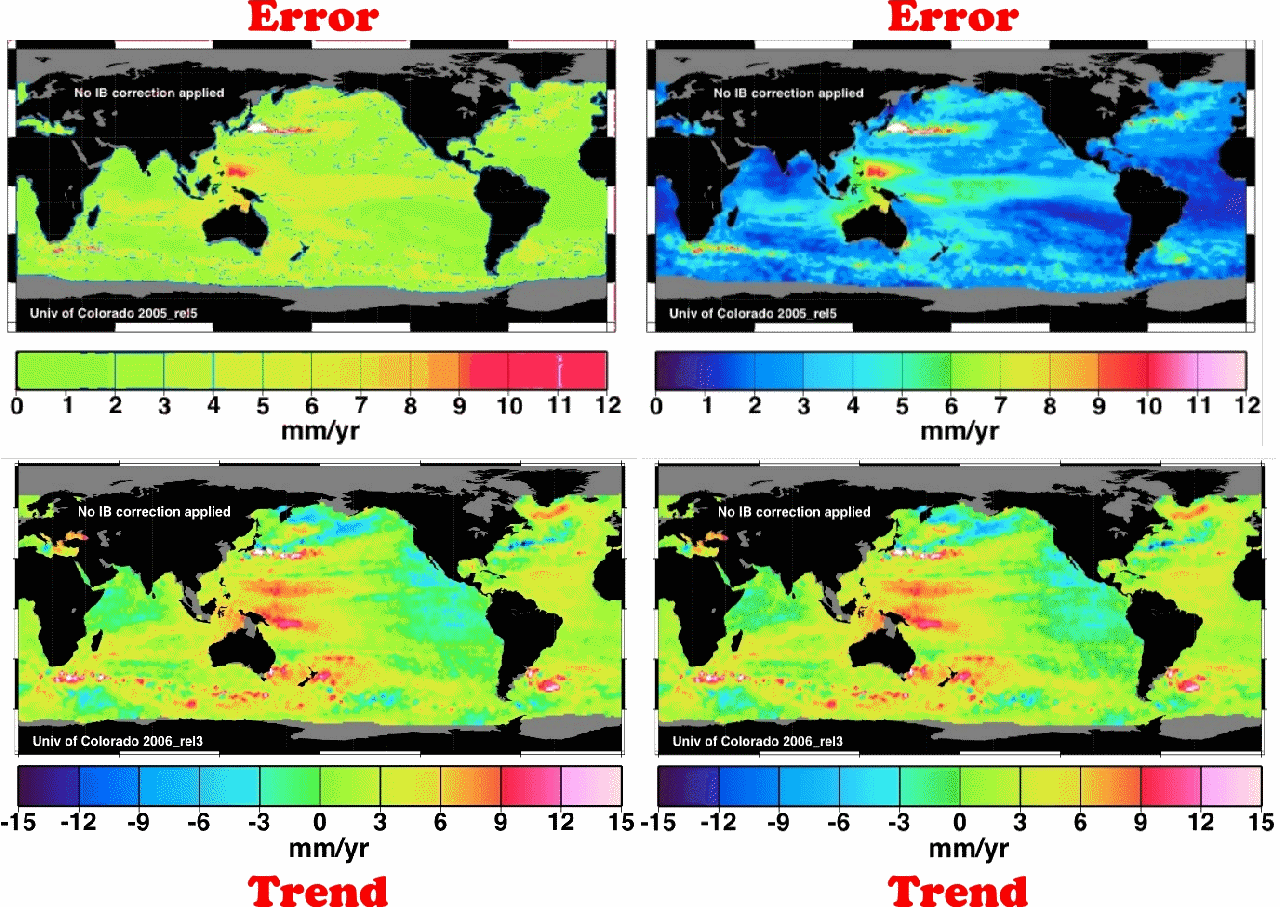


a) How can ‘sea level rise’ be different for different places on the globe?
b) Looking at the diagrams, a really good case can be made for land elevation change rather than water level change.
In most places, sea level rise is really continents rising or sinking or tilting, in addition to a very slow rise in actual sea level. In Alaska and Sweden, etc., there is glacial rebound and the sea level is lowering. And there is local rising and sinking as well. But in Hawaii, where no continental shifting can occur, sea level rise is not accelerating, it’s rising at a constant 1.5 mm a year: https://tidesandcurrents.noaa.gov/sltrends/sltrends_station.shtml?id=1612340