Real Climate Science
"Science is the belief in the ignorance of the experts" – Richard Feynman
Skip to content
Home
1871 Climate Superstition
1970s Global Cooling Scare
About
Alterations To Climate Data
Alterations To The US Temperature Record
Bad Weather
Below350.org
Climate Racketeering
CRU Temperature Fraud
Data Tampering At USHCN/GISS
GHCN Code
Glacial Retreat Before 1910
Greenland Meltdown
Hansen – The Climate Chiropractor
Hide The Decline
Historical References
Ice Free Arctic Forecasts
Maps and Graphs
NASA Sea Level Fraud
Northwest Passage
Polar Meltdown
Predictions By The World’s Greatest Scientists
Scientific Consensus For Life On Mars
Search Results
Spectacularly Poor Climate Science At NASA
The Bottom Line
The Definitive Data On The Global Warming/Climate Change Scam
The Holocaust Began With Gun Control – After A Shooting
There Is No Climate Crisis
Tips And Suggestions
Tracking Climate Fraud
USHCN Code
Who Is Tony Heller?
←
US Trees Controlled By Global Temperature Graphs
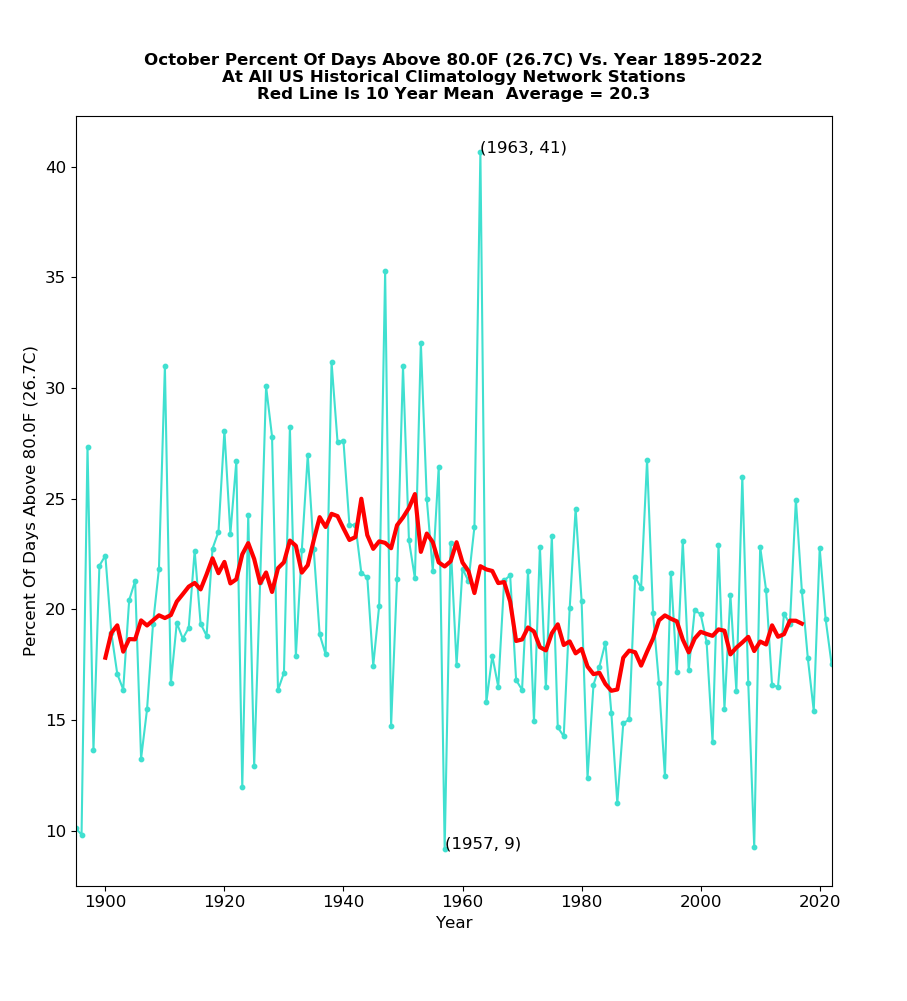
October-Percent-Of-Days-Above-800F–267C–Vs-Year-1895-2022-At-All-US-Historical-Climatology-Network-Stations-Red-Line-Is-10-Year-Mean–1895-2022-max-70-min-0-prcp-0-snow-0-y2-
By
Tony Heller
|
Published
October 29, 2023
|
Full size is
907 × 1001
pixels
October-Percent-Of-Days-Above-700F--211C--Vs-Year-1895-2022-At-All-US-Historical-Climatology-Network-Stations-Red-Line-Is-10-Year-Mean--1895-2022-max-70-min-0-prcp-0-snow-0-y2-
Image-2023-10-28-18-06-22
Bookmark the
permalink
.
Leave a Reply
Cancel reply

