
Last summer, University of California scientists made this hysterical claim about the Zachariae Isstrom glacier in northeast Greenland.

Massive northeast Greenland glacier is rapidly melting, UCI-led team finds
It’s a great story, only problem is it is a complete fabrication. If anything, the glacier has grown since 2012.

2012: EOSDIS Worldview 2015 : EOSDIS Worldview
In 1940, scientists reported that glaciers in Northeast Greenland were receding very rapidly, and were “nearing a catastrophe.“
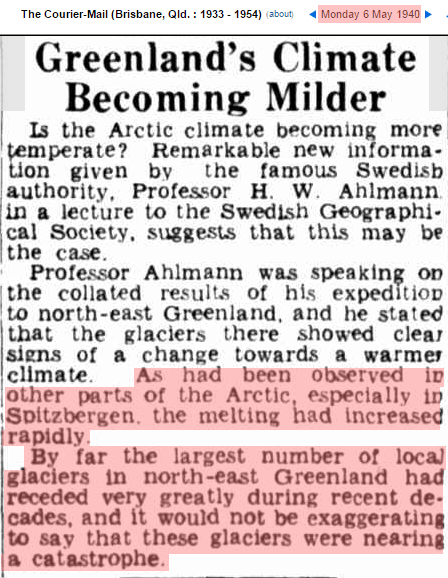
06 May 1940 – Greenland’s Climate Becoming Milder – Trove
The glaciers are still there, there is no catastrophe, and the only thing that has changed is that the fraudsters at NASA have erased the 1940’s warmth in that region.
If the glaciers were receding rapidly in 1940 and are not now, then it must have been warmer in 1940 than it is now. But logic and data are not a part of the criminal venture known as “climate science.”

The novelty of correcting your mistakes is fast wearing off “Steve”.
I strongly suggest you examine your first image carefully and then click this link:
http://go.nasa.gov/1Y1hmsO
Look at all the luvverly melt ponds!
Jim, when I look at the true color visible images on NASA’s WorldView I see melt ponds in northeastern Greenland every year in early August (they have summer data for 2012 through 2015). Nothing unusual about that. It’s called summer. I see little difference in the melt ponds from year to year, not a big increase each year. So what is your point?
Prior to the invention of CARBON in 1980, there were no melt ponds in any glacier on Earth. This is obvious to any Scientist™ who bothers to read the Real® Scientific™ Peer Reviewed© literature (that is to say, only stuff gleaned form the weblog of a failed cartoonist with a rather odd fixation on dressing himself & his buddies up in “snappy” “WWII” uniforms).
My point is that “Steve’s” animation is of the wrong glacier. The one the UCI scientists are talking about is the one with melt ponds visible near the calving face in the Worldview image I linked to.
Jim, your link is to a view of the glacier on August 2, 2014. I see similar melt ponds on that glacier in the other three years available on WorldView: 2012, 2013, and 2015. I see no evidence of anything out of the ordinary for that time of year.
Oz – My link is centred on the calving face of Zachariæ Isstrøm, whereas “Steve’s” animation shows Nioghalvfjerdsbræ but not Zachariæ Isstrøm. Can you spot the difference yet? If not, here’s some additional information that you may find helpful:
http://GreatWhiteCon.info/2015/11/new-calving-of-the-zachariae-isstrom-glacier/
Jim, yes I understand which glacier you are referencing. I also went to NASA’s MODIS Rapid Response website, which has MODIS imagery (non-georeferenced) back to 2006.
https://lance.modaps.eosdis.nasa.gov/realtime/
I looked at images from early August 2006 and see plenty of melt ponds on that glacier back then as well. I don’t see that these melt ponds are unusual in early August, so I don’t understand all the hysteria.
Oz – What “hysteria”? I was merely trying to direct the attention of the viewer away from the wrong glacier (the one without melt ponds) towards the right glacier (the one with melt ponds).
Jim, the “hysteria” I referenced was from the UCI article that was linked in this post where they blame “climate warming” and point to a 39 inch rise in sea levels if the two glaciers fully collapsed with the implication that man-made climate warming will cause this to happen. As I said before, the melt ponds do not seem to be getting worse each year, so I doubt that increasingly warm air is involved. Other commenters have pointed out that volcanic melting from below could be a major factor and this was not even discussed in the referenced article. The article did mention warmer ocean water as a possible factor, but implied that was from man-made warming as well, with no mention that the ocean warming could be from natural ocean cycles in the North Atlantic.
Too bad we don’t have high resolution satellite imagery for the last few thousand years or more. It would be interesting to see the ebb and flow of these glaciers over longer time periods. I suspect that there have been many advances and retreats during that time. Maybe our descendants will have this privilege many years from now as the Earth enters the next glacial period. I suspect they will look back to this time and laugh at the folly of predictions of catastrophic global warming induced by man-made CO2 emissions.
In which case take a look at the this:
http://go.nasa.gov/1Z4PZOG
The “hysteria” as you call it isn’t about melt ponds. It’s about the fact that not so very long ago the ice on the left of Kap Zachariæ was joined to the ice on the right of it.
As you can see, that is no longer the case.
Why do you care Jim?
Any pictures of the glacier back from when the Arctic was ICE FREE in summer most of the time.
You have just admitted that your HYSTERIA is based on IGNORANCE of the true state of the Arctic and Greenland before the massive freezing of the LIA.
That is an IGNORANCE that you perpetuate.
“Why does Jimbo care”?
He doesn’t give a rat’s about anything except desperately trying to get visits to his CON of a web site, and ingratiating himself with the climate clowns at Exeter Uni.
1976 looks pretty much similar to 2015
https://i2.wp.com/s19.postimg.org/6ktz2ofxv/Zachariae_Isstrom_1976.png
Andy – I don’t suppose you can find a pretty picture of Zachariæ Isstrøm instead of Nioghalvfjerdsbræ can you? That’s the glacier that “entered a phase of accelerated retreat in 2012” instead of the one that didn’t.
The image I posted, from 1976, matches the image that the AGW twerp in the article that the post is actually about.
NO change since 1976….. if the moron who wrote the article posts the wrong picture, that’s his problem. He’s obviously one of your cohort.. so he is obviously a MORON.
And I don’t suppose that you could actually stop LYING about the REALITY of the current sea ice situation….
…. not a possibility.. LYING is what you ARE..
its deeply embedded in your sewer of a persona.
TELL THE WHOLE TRUTH ABOUT THE REAL HISTORY OF ARCTIC SEA ICE THROUGH THE HOLOCENE.
I DARE YOU,
You mean the other branch
http://s19.postimg.org/fh9ckcvxv/this_one.png
Not much change from 1976 to now , hey..
Considering 1976 was the trough of the AMO and now is pretty near the peak..
You really have nothing but a tiny prick.
Poor Jimbo…. his similarity to Monty’s “Black Knight” is uncanny.
Hooray! Finally a picture of the correct glacier. Where do you suppose the calving front is in that picture?
Here’s what the “hysterical” paper by Mouginot et al. referenced in “Steve’s” original post had to say about the wrong glacier:
“The calving front of Nioghalvfjerdsfjorden glacier retreated by only a few km between 2002 and 2012”
Yawn.. you truly are a pathetic little man..
Still trying to push you HYSTERIA on the world
Anyone got a magnifying glass ?
Jim is about as FOS as anyone I converse with. The article says “retreat” but there is no retreat.
Have you tried looking at the right glacier yet “Steve”?
You mean the one your mate puts a picture of in his article?
Seems SG has EXACTLY the same glacier… with pretty much the same extent.
If its the wrong glacier.. there is ONLY one person to blame, and its NOT SG.
Jim, you are so full of shit…
NASA lies.. Andy just posted 2 pictures of the same Greenland Glacier 40 years apart.. they look the same..
Where’s the Catastrophe??
Pity you weren’t around to see the melt ponds during the first 3/4 of the Holocene, Jimbo.
Are you still HIDING from the real truth about Arctic sea ice, that being that it is anomalously high compared to the rest of Holocene, except the last couple of hundred years that were the COLDEST of the last 10,000 years
Run and hide from the truth, JImbo… its what you do.
You are a worthless coward
Reblogged this on Canadian Climate Guy.
Crikey, the North Atlantic temps are dropping quickly.
http://s19.postimg.org/lgieg1epf/North_Atlantic_SST.png
We can expect a significant re-freeze of the Arctic and upper NH as it continues to drop.
Will be so funny to watch the Arctic sea ice scaremongers crawl back into the crevasses from whence they came :-).
Unfortunately, the people living up there could do with LESS sea ice, but that phase looks like its pretty much over.
It MUST be due to Global Warming.. LOL !!
Apocalypse…starting “The Day After Tomorrow”..
A montage the temperatures from 8 Icelandic weather stations.
http://s19.postimg.org/45zuayng3/iceland.jpg
One thing strikes the eye: as soon as Ecological National Socialist politicians began funding the IPCC with tax money, the curve slope became nicely positive for a decade and a half. But I am pretty sure no such political event happened in 1919, yet the curve shot up nicely way back then, with global population under 2 billion.
Reblogged this on Climatism and commented:
NASA GISS’ asphalt car park and airport based, UHI affected thermometers are much more accurate records of global temperature than satellite, visual and or historical ones combined. /sarc
HadCet for April has negative anomaly
https://sunshinehours.net/2016/05/01/hadcet-apr-2016-mean-temperature-tied-for-217th-warmest-out-of-358/
If you come here and try to argue against these posts with links from the NASA website, you’re gonna be made a fool of. We’re talking about the same people who told us for years and years and years that there was a hole in the ozone layer, they are the biggest liars. And who did they blame for that hole? That’s right, us, same as climate change, I don’t know why they insist on using propaganda to scare us and then blame us for it but trying to do that here is like bringing a knife to a gun fight.
“like bringing a knife to a gun fight.”
Jimbo brings a soggy rag, flapped by a limp wrist..
But BobbyK there still is a hole in the ozone layer during winter, it’s easy to measure with satellites. Is this some weird global conspiracy-theory again?
No, Just a NATURAL , PERIODIC occurrence.
Are you REALLY so DUMB that you don’t know that? !!!!!
Yes.. of course you are.
Proven time and time and time again,
So what “natural & periodic” process put’s CFCs in high altitudes of the atmosphere? Did the apes have a technologically advanced culture before the last ice age???
Apparently you are forced to believe that chemists, especially ones goin atmospheric chemistry are also part of the GLOBAL CONSPIRACY?? LOL 😀
So, no proof what so ever.
CFC’s are no longer produced or used.
But as you tell us….. there is still an fluctuating OZONE hole.
Funny about that.. obviously CFC’s not to blame
cFool lives up to his name…… yet again.
The so called Ozone hole was noticed in the late 1950’s.
I sent a link of the 1905 Valdez glacier article to a colleague with a petroleum engineering degree and no axe to grind. He sent me back this set of graphs produced by the IPCC jug band (the piper that plays the tune called).
http://www.grida.no/publications/other/ipcc_tar/?src=/climate/ipcc_tar/wg1/fig2-18.htm
The text admits the graph is altered, the curves “translated” to make them “fit.” Eight of the 19 are stable or increasing with the biggest bounceback in the only semilibertarian country listed. My question is: has anyone honest conducted measurements for any of these glaciers to see if the data are fabricated?
Interesting that ALL of the longer term records show them were melting WELL BEFORE CO2 could have had any affect.
Its almost as if there was a REALLY COLD PERIOD that ended in the mid 1980’s 😉
nobody noticed my typo. 1880’s not 1980s.
All the long term ones show basically level until 1880, then retreat.
Several have levelled off or started to grow since 1980.
Reblogged this on TheFlippinTruth.
Then there’s this https://www.youtube.com/watch?v=XM62eTr8gqA, any truth behind this or is this guy just basing his claims off of what Gavin Schmidt says and it can all be debunked?
https://wattsupwiththat.com/2014/07/29/epa-document-supports-3-of-atmospheric-carbon-dioxide-is-attributable-to-human-sources/
3% of 0.4% is 0.0012% The video is CORRECT
Readfern is a RABID AGW propagandist, with a very bad reputation for NOT knowing anything about climate and for basically “making it up” in most instances.
typo ….. major whoops.. left a zero out of fist line of my comment
3% of 0.04% is 0.0012% ….The video is CORRECT
Sorry, unless I am going mad, you are all wrong!
1. 400ppm = 0.04%;
2. 3% of 0.04 = 0.000012%
The video is actually Incorrect!
Yes Paul.. you do seem to be going mad.
3% of 0.04% is 0.0012%
take the 0.04, times by 3 = 0.12
divide by 100 (move decimal point two places left) = 0.0012%
Now if you want to leave the percent off and write as a decimal..
then the number is 0.000012
I suspect that is where your confusion comes from.
thank you for your vigilance
Zachariae isström has been exhibiting both grounding-line retreat and surface lowering, the hallmarks of flow acceleration and volume-loss.
Figure 2 shows surface-height measurements in the area, the spreading of surface-lowering is already evident by 2008:
https://escholarship.org/uc/item/2mm314zr.pdf
The situation has not improved since 2008 and the area is losing ice mass and therefore contributing to sea-level rise.
Oh dear…….. yet again your IGNORANCE lets you down.
https://s3.amazonaws.com/jo.nova/graph/polar/arctic/greenland/greenland-heat-crust-geothermal-ngeo2689-f1.gif
Are you arguing that a new volcano is forming there as we speak, or how does that explain the recent thinning and acceleration of the Zacharias glacier?
ps. notice that there’s absolutely no hotspot under Jakobshaven isbrae, the fastest ice stream in the world that has been getting even faster during the recent years. so, again, the explanations for recent Greenland mass-loss that are echoing in denialist websites are bunk, as usual.
Ah I was hoping you would bring up Jakobsen.
You obviously never bothered reading the last information from several days ago. DOH !!!
WILFUL IGNORANCE on your behalf.. you seem to WANT to be DUMB.
Jakobsen has also been melting since the LIA.
http://s19.postimg.org/vkl9jrfhv/jacobsen.png
It plugged a bit at the confluence of the two glaciers, then once that cleared, resumed its NATURAL MELTING.
I bet you have absolutely no idea what I am talking about….. right!
That’s totally you fault, for never getting a proper education.
Oh look, around about 2005, it basically stopped, after its LONG TERM retreat.
Why would it do that.
Obviously because the temperatures stopped rising.. right ?
https://upload.wikimedia.org/wikipedia/commons/3/30/Jakobshavn_retreat-1851-2006.jpg
Oh look , a more recent one… stalled from 2005-2010
part of it even advance from 2009-2010….
Now explain why, bozo… I bet you can’t.
https://i2.wp.com/www.buffalo.edu/content/dam/www/news/imported/hires/jakobs_retreat1.jpg
Oh my Gosh Andy…
At what point do we all die?
Perhaps “The Day After Tomorrow”??
It should be noted that cFool calls to Zachariae isström glacier , which is very much above the volcanic zone.
http://s19.postimg.org/chssmdqr7/zac.jpg
… then, once called out, switches to the NE of Greenland (and is again shown to be an ignorant cFool.
The cFool is a child-minded LIAR and a very low-intellect propaganda CON-ARTIST.
Poor cFool, you are doing irreparable damage to the AGW cause with your base-level dumbness.
Nice to see you agitated. The NEGIS ice stream feeds both Zacharias and the 79.5 degree glacier.
The changes are happening in ZaCharias and will propagate up NEGIS to some degree, stay tuned.
I find people as dumb as you are amusing for a short while.. that’s all. 🙂
sort of like a child chucking a tanty in a supermarket… and getting absolutely nowhere.
That glacier has been retreating since the mid 1800’s, plugged, then let go.
TOTALLY NATURAL
DENY that fact all you like. Its what AGW cultists do.. DENY facts.
“The NEGIS ice stream feeds both Zacharias and the 79.5 degree glacier.
The changes are happening in ZaCharias and will propagate up NEGIS to some degree”
Good to see you recognise it as totally natural. Thanks for the confirmation.
NEGIS stream
http://www.21stcentech.com/wp-content/uploads/2014/03/GreenlandIceDrainage_e_0317.jpg
Volcanic area
https://s3.amazonaws.com/jo.nova/graph/polar/arctic/greenland/greenland-heat-crust-geothermal-ngeo2689-f1.gif
Poor cFool. The Negis stream source is directly over the volcanic area… DOH !!!
There is plenty of evidence that the Icelandic/Greenland Magma blob has been more active recently.
Do you really think that a slight basal melting of the upper part of a glacier would not cause it to flow a bit faster? Really ??
In many places in Greenland is climate is already clearly warmer than in the 1930’s, see page 50 of this report by The Danish Meteorological Institute (Greenland belongs to Denmark):
http://www.dmi.dk/fileadmin/user_upload/Rapporter/TR/2015/tr15-04.pdf
Have you ever heard of the LITTLE ICE AGE?
Thank goodness there has been at least SOME small amount of warming since then..
Where.. approximately only, do you live?
A WARM place, like somewhere in Australia?
or do you covert the FREEZING COLD, and live in Siberia.?
Come on cFool ..
is it inner city Melbourne?
or inner city Sydney ?
Or some other inner city ?
So it’s “normal” that “recover from LIA” is taking temperatures higher than pre-LIA? Sounds like BS to me…
So, no answer to a simple question.
Now why would that be?
And its certainly NOT taking temperature higher than before the LIA.
The MWP was undoubtedly warmer than present.
And Certainly the RWP and Holocene Optimum were.
FFS, they even have a terminology for the massive cooling since BC2000
Look up the term “NeoGlaciation”
And please, try to learn SOMETHING for once in your child-minded life.
STILL no answer.
….. too cowardly to display your hypocrisy, is my guess.
Darn, those curves are an UNCANNY MATCH to the smoothed solar cycle !!!
http://www.lunarplanner.com/Images/Sunspots-400Years.png
Who/what is requiring you folks to believe that ozone depletion caused by CFCs is a fraud/conspiracy? Any religious basis for that for example?
“Any religious basis for that for example?”
You would have to ask your AGW and catastrophist priests.
Who/what is requiring you folks to believe that ozone depletion caused by CFCs is a fraud/conspiracy? Any religious basis for that for example?
Sorry I couldn’t find you any of your precious religious texts on ozone depletion, all I have is science…
“The primary role of dynamical processes in determining the thickness of the ozone layer has also been established in other extensive field work. On Dec. 1,Geophysical Research Letters, a joumal of the American Geophysical Union, published a scientific paper by scientists from Norwegian and Russian institutes demonstrating that the thickness of the ozone layer over Russia is determined by meteorology, not chemistry. (2)The scientists, Kjell Henriksen from the University of Tromso in Norway and Valentin Roldugin from the Polar Geophysical Institute in Russia, analyzed one year of daily samples from six Soviet Middle Asian ozone measuring stations at two different altitudes.
They discovered that changes in the ozone layer were directly caused by the horizontal and vertical movement of air masses (that is, wind dynamics). A close analysis of the data also demonstrated that chemistry played no role in the thickness of the ozone layer over these stations. Theauthors discuss the implications of their work in detail:
Intensive investigations on irregular variations of the total ozone during the last years point out many phenomena as possible sources. Influences related to homogeneous and heterogeneous chemistry, volcanic activity, solar proton events, and other forms of solar activity are documented … The main cause, however, may be influences from meteorological conditions, and these relations have got much less attention. The role of horizontal advection and vertical motion as a significant source for ozone column variations has been studied more than 40 years … Recently Rabbe and Larsen (3) have indicated dynamic processes in the atmosphere as a main reason of ozone variations and ozone “miniholes.” They show that ascending motion of the air is accompanied by dilution of the ozone layer, and vice versa, descending motion of the air causes enhanced density of the ozone layer. The causes of ascending and descending motions are often winds blowing across mountain ranges. Such vertical air movements will cause adiabatic expansion and compression with cooling and warming in time scales down to a few hours. Chemical processes can also contribute to ozone variations, but here the time scales are days. On the other hand, ozone variations with periods in the order of 10 days, and seasonal variations as well can also be explained by dynamic meteorological reasoning.
After a detailed analysis of the Russian data, Henriksen and Roldugin conclude with a sharp reminder to the promoters of the ozone depletion fraud that they cannot arbitrarily exclude factors other than chemistry from their models:
The question of so-called “ozone depletion” has to be investigated from the point of view of long-term variation of general circulation in the atmosphere. Models of “the depletion,” as summarized in [the World Meteorological Organization’s] WMO Report, must realize that the meteorological conditions have significant effects on the ozone layer, being the main cause of seasonal as well as most of the shorter and apparently arbitrary density and thermal variations.“
It was partly depleted because of the super cold weather and darkness for weeks in the polar region,that is the main cause of the temporary lower levels.
cd, you need to read the latest literature on ozone formation and depletion . it is cfc lite.
Jakobshaven’s speed-up and thinning did not stop around 2005 but are close to record levels right now. You really should get your information about the state of the cryosphere from somewhere else than the denialist blogosphere..
Retreating since LIA..
You really don’t understand anything about fluid flow , do you..
You poor ignorant little worm.
Again this blog is spreading falsehoods about the arctic – this time about the ice streams in NE Greenland. What could be the motivation of spreading BS like this?
No falsehood here… just REAL DATA, as anyone can see.
What falsehood is there in the REAL DATA I have posted….. NONE
What is YOUR motivation for your IGNORANCE?
True, anyone can use freely available software and data to measure the acceleration in speed of Zachariae glacier. The change in the glacier is therefore an observable emprical fact. So then, why is this blog spreading completely asinine incorrect statements about the state of the glacier? Got ideas about that?
So, again you display your IGNORANCE of fluid flow through confluences.
Keep going.. its funny !! 😉
The state of the glacier which you switched to is obvious.
It is undergoing some NATURAL continued retreat… so what..!.
All part of the NATURAL AMO cycle after the climb out of the LIA.
Stand by for the advance over the next few decades.
Oh sorry.. you don’t know what “confluence” means, do you. !
You are IGNORANCE personified.
Oh dear.. cFool faceplants yet again
http://notrickszone.com/2016/04/14/climatologists-stunned-and-baffled-new-scientific-studies-show-glacier-ice-sheet-melt-rates-rapidly-decelerating/#sthash.JQ2c4anu.dpbs
Zacharias & Jakobshaven are continuing mass-losses together with many other large glaciers in Greenland. Interesting to see that notrickszone does not appear to get the difference between SMB and MB, like many pundits in here. I guess people keep blogging misunderstandings for so long that they appear to turn into “truths” in the denialiosphere…
“continuing mass-losses together ”
Since the Little Ice Age, as amply proven in many places.
You have NOTHING except your brain-washed ignorance., cFool.
Meanwhile…. Greenland surface mass gain proceeds apace, push the glaciers towards the sea.
http://s19.postimg.org/h57hf8awj/greenland_mass_balance.png
Again you are spewing misunderstandings. Greenland was not losing mass up to late 1990’s, which by the way is 100+ years since the end of LIA. Why do you want to call a sudden change 100+ years after the end of LIA “a recovery from LIA”?
Oh, you are now saying we have stopped warming out of the Little Ice Age. On that we can agree.
There has been NO sudden change apart from the solar/wind forced transient El Ninos.
You are dead-parroting the baseless alarmist propaganda… as is your modis.
Stop spewing , its unbecoming… even of you.
Ugh, Greenland is Gaining Ice.. not losing it..
Wake up.. yours are Models, not Actuals..
“There is plenty of evidence that the Icelandic/Greenland Magma blob has been more active recently.”
Ok, so what evidence are you referring to?
And really, the magma blob does not even begin to explain the mass-loss at Jakobshaven. Also the changes in Zacharias appear to be oceanic in nature, but the bottom-melting might explain why NEGIS is that long.
You have shown many, many times that it is totally pointless putting facts in front of you.
Find it yourself…or REMAIN IGNORANT..
Dude I’ve forgotten more facts about the Greenland ice sheet than you have ever known. Educate yourself how processes near the grounding-line can cause acceleration of the glacier.
You certainly proven that you have no facts about the Arctic or Greenland.
Keep up the good work.
Grounding-line.. you mean warming from underneath… NOT atmospheric.. … ok, 😉
You have just told us that the whole melting is either from volcanic or AMO affects, just like I have been saying all along.
Thing is, the AMO is now heading downwards and the Northern Atlantic is cooling quite quickly.
So, little child-mind.. run and hide from the cold, back in your inner city tenement, with your coal-fired electricity. It what you do.
Dude, like totally. Scienting is like, uh, man, pass that bong will ya, I can’t think without it. Dude.
I do enjoy the public ignorance of those who use GREENLAND for the purpose of “proving” that human-caused CO2 is melting all its ice. Apparently they are immune to wondering why it got that name, a name bestowed long before the AGW farce was invented.
Its certainly funny watching cFool bend his arse to the AGW meme, and take it all.
History is not kind the AGW agenda….. they must ignore that history.
Future history will NOT be kind to those who were dumb and unthinking enough to fall victim to its propaganda. cFool is a prime example.
cFool…. Did you figure out an answer to the question about if you live in a warm inner city place, with coal fired electricity and all that..
or do you live in a cold dank place with zero access to fossil fuels……. malnutrition, and pre-mature death all around you .
Which one is it?
Come on.. have the GUTS to answer.
Oh look .. still no answer.
You poor little inner city , soy-decaffe-latte, warm-loving coward.
I’m not trying to say that the rapid changes in Greenland are man-made, but they certainly could be. This blog is always trying to distort the evidence about arctic changes so it’s nice to set the record a bit straighter.
So where can we find examples of you setting the record “a bit straighter” on alarmist sites?
I doubt that cFool could LIE straight….. anywhere.
It’s more cost-effective to pick the low-hanging fruit 1st, i.e. to point out the flat-out lies and misunderstandings posted here.
So failed models and failed predictions are too high for you to cherry pick? Instead you push nothing but the extreme CAGW mantra.
Why not just admit the truth is not your agenda? Andy has proven this daily for months now.
” the flat-out lies and misunderstandings posted here.”
Just look for the deep crimson avatar in front, and the non-word moniker starting with cd…
Easy to find.
You mean the evidence of NATURAL cycles.?
You do know that the Arctic sea ice levels are way above average for the last 10,000 years, don’t you.
There is ABSOLUTELY NOTHING UNTOWARD happening to Arctic sea ice, except a general long-term recovery from the LIA, and the affects of the AMO.
And no-one can prove otherwise.
Certainly not you with your cretinous little rants.
Greenland is going to contribute even more to sea-level rise and the arctic sea ice is likely to disappear during summers in the not-too-distant future. It seems pretty probable that the sea-level is going to rise by a few meters in the next couple of centuries. In other words, the climate is changing 🙂
“It seems pretty probable that the sea-level is going to rise by a few meters in the next couple of centuries. In other words, the climate is changing:)”
====================================
Reduced to baseless assertions now extending out two centuries, when the only decent observable we have, long term global tide gauges, show ZERO acceleration in SL rise.
“You do know that the Arctic sea ice levels are way above average for the last 10,000 years, don’t you.”
You are fond of moving goalposts aren’t you? When your “recovery from LIA” idea does not have much supporting evidence you suddenly change the timescale by two orders of magnitude..
“Greenland is going to contribute even more to sea-level rise and the arctic sea ice is likely to disappear during summers in the not-too-distant future”
UTTER SPECULATIVE BULLSHIT.
Deal in FACTS, not fantasy.
I repeat, since you are so dumb you can’t understand basic FACTS
There is ABSOLUTELY NOTHING UNTOWARD happening to Arctic sea ice, except a general long-term recovery from the LIA, and the affects of the AMO.
“When your “recovery from LIA” idea does not have much supporting ”
It is overwhelmingly supported by facts…..
All these glaciers have been melting since before the mid 1800’s., but we are still nowhere near the warmth of the first 80 odd % of the current interglacial.
Very much at the COLD end.
“You are fond of moving goalposts aren’t you?”
So you are saying that REAL Arctic history should not be brought into discussion of Arctic sea ice.
You seem to be SCARED of real facts and data.
You must DENY, DENY those FACTS and DATA
http://s19.postimg.org/fj69ahgoj/Iceland_Sea_Ice.jpg
The changes in the Arctic and Greenland are not “alarmist propaganda” but verifiable facts. I notice that the standard narrative here is changing from the previous “no changes are happening” into “the changes that are happening are all natural”. Very predictable I’d say.
Nobody said no changes are happening. Arctic ice changes are cyclical. This is verified and something you are not capable of comprehending. You really think this one glacier could raise global SL 18 inches, and has been collapsing faster then ever in recent years. Then why do global tide gauges show no acceleration in paltry SL rise of about four inches per century?
Tide-gauge coverage is pretty poor but according to studies the sea level rise was slower 100 years ago than it is now:
http://sealevel.colorado.edu/content/tide-gauge-sea-level
The chart you reference does not show that sea levels are rising faster than 100 years ago. The chart compares different data sets. And when you figure in the error bars, there is not even appreciable change between the different data sets. But I bet someone told you there was, and being the gullible little liar you are, you swallowed it whole without question.
How stupid are you?
CFool is EXTREMELY stupid.
cFool continues to be a FACT-FREE non-entity.
Not nearly as predictable as alarmist adjustments, which always work to support the failed hypothesis. And not nearly as predictable as you, who never confronts alarmists over their inflated rhetoric, but who always pisses in the wind anytime a skeptic refutes CAGW alarmism.
This was a reply to cfool’s statement…
Very predictable I’d say.
“who always pisses in the wind anytime a skeptic refutes CAGW alarmism.”
And it always blows back in his face. His beverage of choice.
is it me, or does the term “interglacial period” mean, amongst other things, warming? SO variable glaciation trends toward reduction? What is the point to glaciers melting anyway?
is it me, or does the term “interglacial period” mean, amongst other things, warming? SO variable ice glaciation trends towards reduction? What is the point to glaciers melting anyway?
I guess it’s my fault that the blog-post I was commenting was monumental BS…go figure.
You have produce absolutely nothing to back your worthless opinion.
All you have produced is monumental, dead-parrot, waffling BS.
Yes.. all your blog comments are monumental BULLSHIT.
Pure BASELESS CAGW rhetoric, backed by ZERO factual information.
You still have not provided ONE SINGLE FACT countering the main blog post.
Enjoy your inner-city coal-fired warmth little cWorm.
So glaciologists are also in the sinister global AGW conspiracy falsifying measurement data? Are there any groups of scientists who aren’t?
Another empty post from cFool.
Can you name even ONE group of scientists who are NOT part of the conspiracy? Perhaps the folks studying the history of the US Constitution aren’t, for example? 😀 😀 😀
Another fact-free post from cFool
So funny.. falling back on the political/funding consensus farce…
… because you have no science or facts to back up your rantings.
Rapid North Atlantic cooling
https://rclutz.files.wordpress.com/2016/04/8ad4c-1461959116553.png
We could, of course, look at a 1976 satellite image of the glacier shown in the very first picture, and viewed them one under the other.
http://s19.postimg.org/6ktz2ofxv/Zachariae_Isstrom_1976.png
https://i2.wp.com/realclimatescience.com/wp-content/uploads/2016/05/2016-05-01102333.png
Where is that picture from?
Can’t take credit…
Billy linked it on your other forum (same thread name).
http://pubs.usgs.gov/pp/p1386c/p1386c.pdf
I just downloaded the pdf and extracted the picture
No.. don’t do that..
Facts don’t matter here.. what matters is the Apocalypse and 2mm/yr Sea Level rise..
I’ve been running, training to outrun the onslaught of water @2mm/yr modeled rate..
The OP is a bit muddled. The glacier primarily referred to in the media report is not the one that appears in the satellite images 2012/2015.
The one in the sat images is said to be melting, but not receding as rapidly.
Also, 2012 was a record year for low Arctic sea ice, which abuts the glacier, there’s going to be more calving that year in summertime. There was open water around the glacier in the sat images in 2012, not in 2015. Of course, researchers would not have been so daft as to crunch the numbers for a total of two days out of 3 years.
When does cherry-picking season come to an end?
Cherries are always in season for alarmists, cherries and BS make up their diet, and their “science”.