
Disrupting the Borg is expensive and time consuming!

Recent Comments
saveenergy on Is Antarctica Melting? saveenergy on 65 Years Of Progress! Jeff L. on Analyzing The Western Water Cr… Morgan Wright on Great Lakes Approaching 100% I… Morgan Wright on Great Lakes Set Another Spring… gelcarrion0t on New Visitech Features saveenergy on Ice-Free Arctic By 2014 gelcarrion0t on Ice-Free Arctic By 2014 gelcarrion0t on Debt-Free US Treasury Forecast gelcarrion0t on Seventeen Years Of Fun
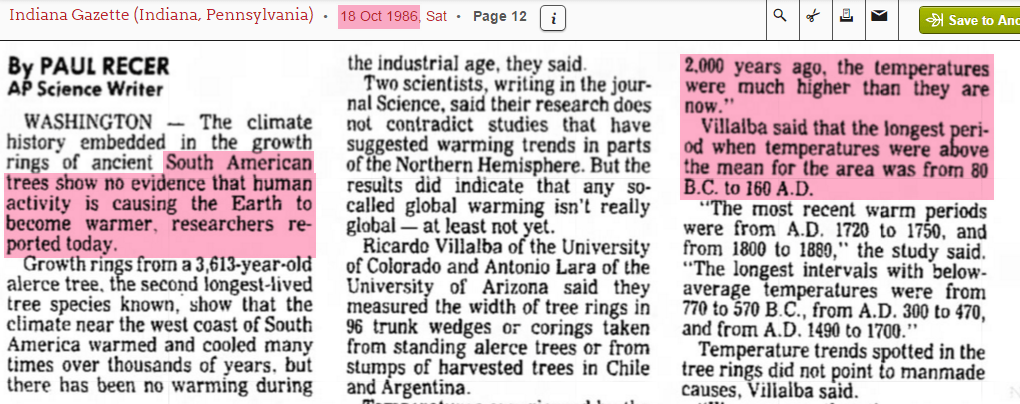
This one is easy to hand wave away, because “since then it warmed a lot and that is no longer true”. Same for the very old tree records from the US, which show the history of climate for over 2000 years.
I really don’t think one can use tree rings as an accurate history of temperatures. That’s silly.
Not silly at all. Very accurate: http://hyzercreek.com/treering.htm
Thank You. That’s very interesting.
It is accurate, as long as you are not the IPCC, and give huge weighting to a few trees that showed no warming in the mid-evil warm period (much warmer and longer than ours that is coming to and end), that is exactly what they did…
http://hyzercreek.com/treering.htm
The other factor for tree growth, is rainfall. But, there is also the matter of CO2.
http://www.sciencedaily.com/releases/2010/02/100201171641.htm
Rainfall, soil conditions, competion, disease,etc. Trees are not thermometers.
But regarding the tree I used there, the only thing that mattered was sunlight.
Michael Mann used bristlecone pines, a highly long lived, and contorted tree, from high and arid regions of the US Southwest.
He knew it was subject in growth to rainfall conditions.
Furthermore, The bristlecones were a small and controversial subset of many proxies used.
Even though no other proxies showed the hockey stick shape; the method used, principal components, allowed the single errant bristlecone record of over a thousand years to be the predominant shape of the hockeystick.
Beyond that, when the graph did not show a recent warming, they truncated it and spliced in a dubious current temperature record which our host as shown to be completely suspect.
Well, surprisingly, given the controversial nature of his 1986 study, he’s still got a job:
http://personal.cricyt.edu.ar/ricardo/
I have seen four studies showing 1,000 year cycles which would coincide with the roman warm period and the medieval warm period.
Until recent junk, records had shown them to be warmer than today.